ROKU Analytical Support
Analytics is about turning raw data into useful information. It is about discovering, interpreting and communicating data into useful and meaningful patterns, then applying these patterns for effective decision making.
This article deals with the analytical support of Roku.
Introduction
ROKU Developers provide ARM developers with the much needed “Analytics Support” The Analytics Tool provided by ROKU development team helps to scan the channel’s source code for local development errors. This tool helps ARM developers to regularly analyze their channel during the development process and to recognize channel certification violations before submitting the channel for publication. ROKU Developers provide some basic analytics to all published, public channels on the platform.
ROKU development team came up with the ROKU Analytics Component Library(RACL) that implements Google Analytics, Omniture, Ooyala Analytics and many other third-party analytics solutions. This library creates a simple method for using SceneGraph channels with one or more of these analytical solutions.
So, let us dive in!
Read Also:- https://4waytechnologies.com/blog/5-steps-to-save-cost-on-application-development/
What are Roku Analytical Reports?
Analytics reports are distinguished between “visitors” and “viewers” according to the below description –
- The visitor is a user who has opened or started a channel but may not have viewed any content or series. Visitors are measured by Account Level.
- The viewer is a user who has viewed the contents, series on the channel. A visitor can be a viewer but not all visitors can be viewers. Viewers are also measured by Account Level.
How to Generate Roku Analytical Reports?
To generate the reports go to:
Developer Dashboard << Manage My Channels << View Anaylitcs.
ROKU automatically generates these reports at Looker Dashboards for your channel (Looker is the business intelligence platform that ROKU uses for providing channel analytics) :
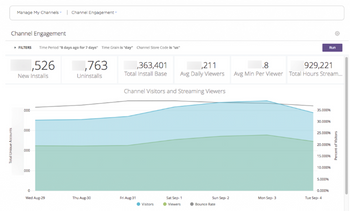
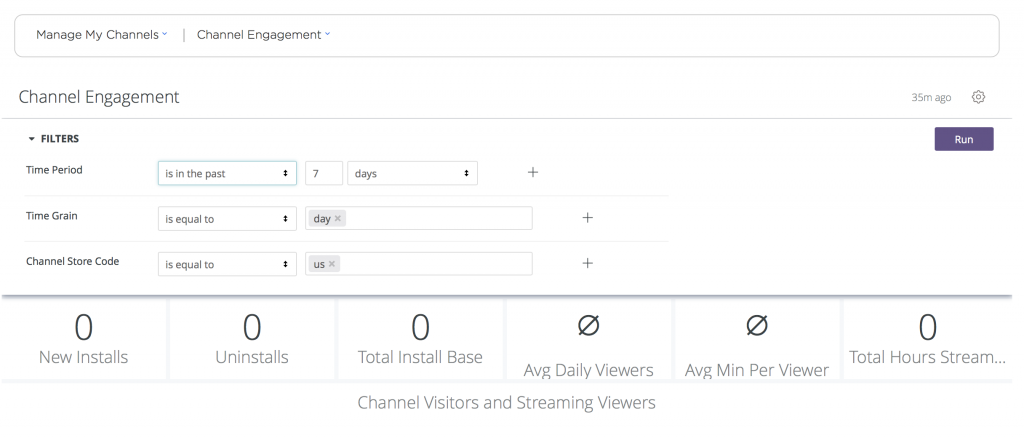
- Channel Engagement – installs, visits and streaming data for all channels.
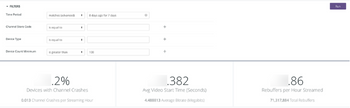
- Channel Health – BrightScript crashes and buffering data for all channels.
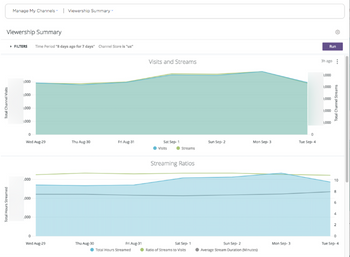
- Viewership Summary – legacy report with a small selection of channel engagement and channel health data.
- Video Statistics – content title-level data. This report is only available for channels created with Direct Publisher.
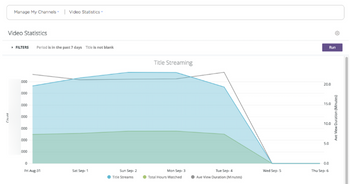
When you choose View Analytics for a channel, the default dashboard “Channel Engagement” is displayed. Click the report dropdown to go to the other reports.
Read Also:- https://4waytechnologies.com/blog/deep-linking-in-roku/
What is Report Layout?
Because channels differ in both business model and technical implementation, the relevancy of specific dashboards and the availability of data therein will vary. For example, data will only be available in the Video Statistic report for channels created with Direct Publisher.
If a dashboard does not pertain to your channel type, it will contain no data. In an effort to avoid confusion, you may see a subset of the dashboards available to you in the developer portal – that subset being the reports pertaining to your channel type.
All dashboards contain a FILTERS section where you can select the channel data to be displayed, such as specifying a particular Time Period. You cannot add new filters but you can leave some filters “blank” to include all available data. More often than not, if the data displayed in the dashboard does not make sense, the reason is a misapplied filter. A mismatch in filters can also return uninterpretable results, such as would be the case if you set the Time Period to be shorter than the Time Grain (e.g. a one week Time Period and month Time Grain).
Dashboards may contain several sections and changing filters will cause some sections to update the values displayed while others may not. This depends on what is being measured and how it relates to the changed filter. For instance, Cumulative Installs is a point-in-time measurement, so changing the Time Grain filter will not change the value displayed for that metric while changing the Time Period will. Users must click on the “Run” button to update values after changing a filter.
Conclusion
After going through this blog, we understand several things related to Roku analytical support. For more Roku-based software solutions, contact 4 Way Technologies, a leading Roku app development company across the globe. Please provide your feedback in the comment section below.

A freelancing blogs and e-books writer who keeps you up with the trending technologies and user guides. A blogger who is currently a post-graduate living in United Kingdom and trying to make her niche as a Data Scientist. Before taking a deep dive into the "Data-World", she got a Bachelor's Technology degree in Computer Science and has always dreamed of writing as a kid which inspired her to write wonderful content with the right amount of technical terms to make it easy for the beginners and as well full-fledged developers to grasp a hold onto the computer technologies.